


Softwares herunterladen
5 Ergebnis(se) :
Qual-SRT & Qual-View
Software for configuration, real-time display and analysis for measurement campaigns with MAP607 and MAP COMPACT network analyzers
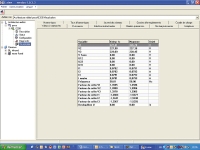
The Qual-SRT software can be used for configuration and real-time display on the MAP607:
- Measurements from the MAP607's two channels
- The number of voltage dips / overvoltages / long outages / brief outages / transients recorded
- Global status of the last EN50160 report
- Memory occupation rate
- Equipment date and time
Dynamic views are also available: graph of trends (logger-type view) and harmonics bargraph up to 50th order. Thanks to the self-declaring ultra-fast USB2.0 link, this module can also be used for near-instantaneous data recovery and deletion of the data in the equipment.
The Qual-SRTc software can be used for configuration and real-time display on MAP COMPACT:
- Measurements of electrical parameters with display of Fresnel diagram and harmonics bargraph
- Total of the active, reactive and apparent energy indices
- Memory occupation rate
- Equipment date and time
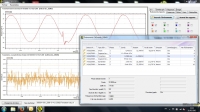
The Qual-View software is the analysis and report generation tool for MAP COMPACT and MAP607:
It offers a veiw of all the trend curves generatedby the equipment, with the possibility of zooming and graphical display of the limits of the qualimetric template for each parameter.
Event-related views with the event signature, waveform and time/date-stamped events log are also available via dedicated tabs in Qual-View.
| setupqualsrt_v1.1.5.13.zip | |
| setupqualsrtc_v1.2.6.1.zip | |
| setupqualview_v1.3.6.16.zip |
TRIADJUST2
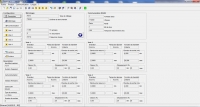
TRIAD2 configuration software
TRIADJUST 2 can be used for:
Configuration
– Inputs (define the CTs, the VTs, connection diagram, etc.)
– Outputs (define the different channels, transfer functions, class, etc.)
– Communication
Diagnostics
– Voltage inputs
– Current inputs
– Wiring
– Phase sequence
– Analog outputs
– Fresnel diagram
Views
– Instantaneous quantities (in digital or analog form)
Recordings
– In real time in exported file
| tradjust2_1_2_0_0.rar |
ELOG Excel Macro
Remote data retrieval and analysis application for the data from ELOG.
The excel macro for ELOG allows you to use the standard excel spreadsheet software (version 2010 or 2013) for quick and easy processing of the recordings from ELOG.
Users can retrieve, display and analyze the data recorded on the metering and measuring equipment connected to an ELOG.
The application can be used to:
- connect remotely to an ELOG by means of its IP address
- view and select all or some of the variables recorded
- retrieve the recorded data and present them in a table (recording date and time / value)
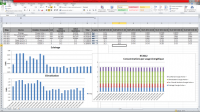
- produce an analytical table of the data (calculation of hourly or daily values)
- produce pre-configured graphs for analysis of the recordings
From the Excel spreadsheet, it is easy for users to:
- modify the tables and graphs
- customize presentation of the results
- export the data in .txt, .csv, .xls or other format for third-party applications
The code of the Excel macro is open-source, so any user can freely upgrade or modify it.
| macro_v1.0_elog_release_5.xlsm_.zip |
E.VIEW
Configuration and display software for your ENERIUM power monitor
E.view software is an essential tool for configuring your ENERIUM power monitor and viewing the information from it.
This software can be used to:
- Program the communication parameters of the products (address, speed, parity, etc.) and the setup parameters (CT ratio, VT ratio, alarm thresholds, etc.)
- Configure the power monitors in the ENERIUM range remotely, via the RS485 network or Ethernet network, or via the local area network with the optical head
- View all the quantities managed by the power monitor (1 s reading, averages, time/date-stamped min and max)
- Optimize multi-product management by creating and displaying the architecture of the electrical installation
- Process the data:
- Summary tables: simplified summary of the results, alarms log, compliance of statistics with EN50160, time/date-stamped events (dips, outages, overvoltages, etc.)
- Data export: alarms log, EN50160 statistics, voltage events (dips, outages, overvoltages, etc.) and waveforms, all in .CSV, .XLS or .TXT format
| e.view_1.5.2.0.zip |
Excel macro for ELOG DATA LOGGER
Excel macro to provide the following functions:
- Remote download of the recorded data from the ELOG DATA LOGGER
- Analysis of the recorded data in preconfigured graphs or tables
| macro_elog_data_logger_20160624.zip |
